

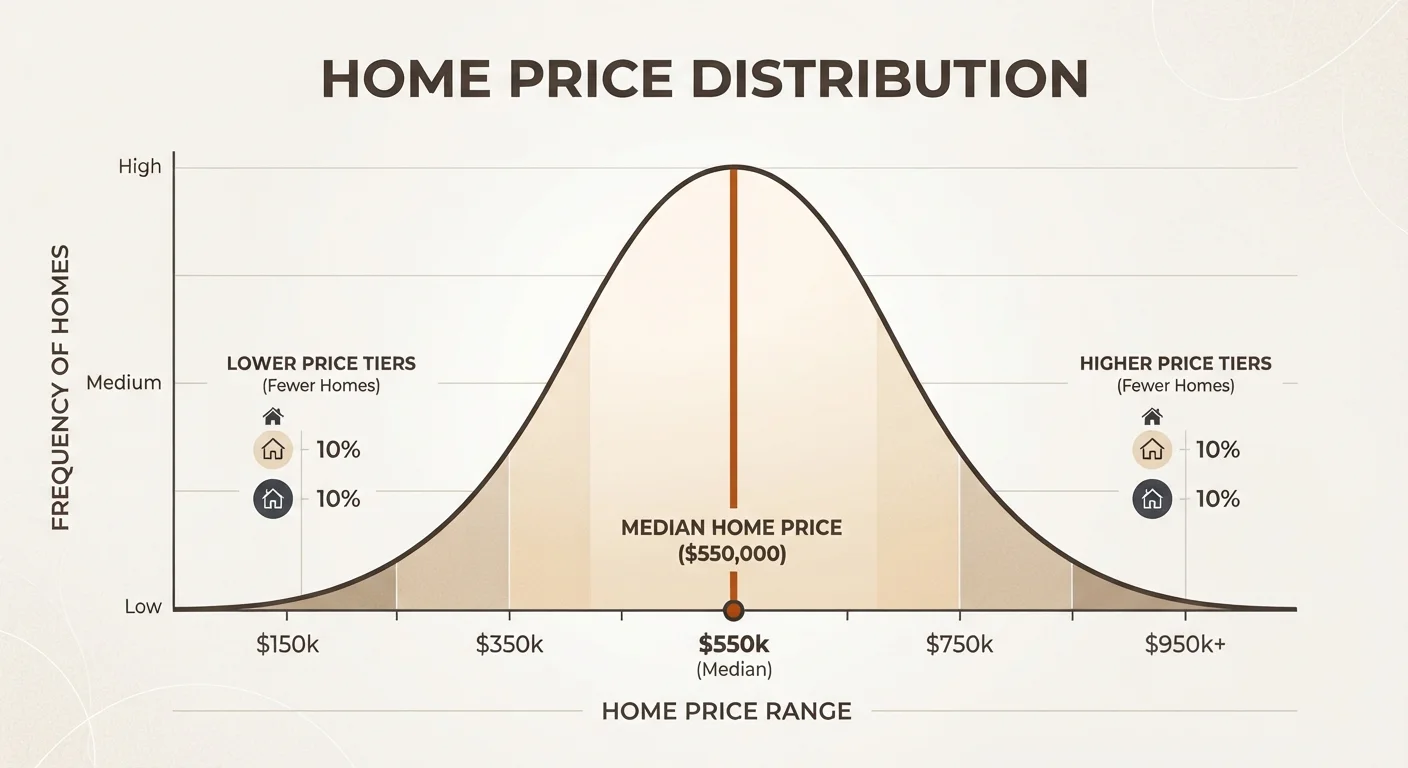
How the Median Is Calculated - and Why It Matters
Imagine lining up all homes sold in a metro area last month from least to most expensive. The median home price is simply the price of the home sitting exactly in the middle of that line. If 1,001 homes sold, the median is the 501st price - 500 homes cost less, 500 cost more.
This construction makes the median resistant to distortion by extreme values. A single $20 million estate sale won't pull the median far from center the way it would inflate a straight average. That robustness is why housing economists rely on median - rather than mean - figures when describing market conditions to policymakers and the public.
Still, "resistant to distortion" is not the same as "impossible to misread." The median is a statistical midpoint of completed transactions, not a price tag on a representative home. That distinction carries significant practical implications for buyers, sellers, and anyone trying to interpret housing headlines.
50%
Homes that sell below the median price
By definition, exactly half of all homes in any given dataset sell below the median - it is a midpoint, not a floor or ceiling.
~4-6 weeks
Typical reporting lag in median price data
Major sources such as the National Association of Realtors publish monthly median figures reflecting closings that occurred weeks prior, meaning the data always describes recent past conditions.
Varies widely
Spread between lowest and highest metro medians
According to NAR market data, median sale prices across US metro areas can differ by several hundred thousand dollars, underscoring why national figures have limited local relevance.
The Mix-Shift Problem: When the Median Lies About Direction
One of the most important - and least reported - limitations of median home price data is the mix-shift effect. The median doesn't just track what homes are worth; it tracks which homes are selling.
During a market slowdown, first-time buyers and buyers of entry-level homes are often the first to step back, priced out by higher mortgage rates or economic uncertainty. If fewer lower-priced homes transact while mid-tier and luxury sales hold steady, the composition of the sold pool shifts upward. The median rises - not because homes got more expensive, but because cheaper homes dropped out of the mix.
The reverse happens in a rebounding market. If a burst of new affordable construction sells quickly, the median can fall even as mid-range values hold firm. Treating either of these movements as straightforward evidence of rising or falling home values leads to poor decisions.
This is why the reading housing market data without getting misled framework recommends always checking the number of sales alongside the median figure - a rising median on declining volume tells a very different story than a rising median on strong volume.
A coastal metro reports its median home price jumped 8% year-over-year. Local agents, however, note that new luxury condo towers delivered hundreds of high-end units that all closed in the same quarter.
A Midwestern city's median home price dips slightly during a quarter in which a large affordable housing development delivered its first wave of sales.
A national news report states the US median home price is $412,000, and a buyer in rural Ohio assumes local homes should be priced similarly.
National Figures vs. Your Local Market
When a news headline announces the national median home price, it is describing a single number derived from millions of highly varied transactions across widely different regions. That figure can be useful for understanding broad trends, but it tells you almost nothing about conditions in a specific city, neighborhood, or zip code.
A market like Austin, Texas may be cooling while one in Hartford, Connecticut heats up - and both can happen simultaneously while the national median barely moves. As covered in depth in local vs. national housing markets, regional divergence is the rule, not the exception.
For practical decision-making - whether you're buying, selling, or simply evaluating whether now is the right time to enter a market - local data always takes priority. Look for median sales price figures from your county's MLS, local real estate boards, or a licensed agent with access to recent comparable sales in the specific neighborhoods you're considering.
“The median home price is a useful barometer of where the market has been, but it tells you very little about where a specific home should be priced today. Local comps, current inventory, and days on market are far more actionable signals for buyers and sellers.”
— Lawrence Yun, Chief Economist, National Association of Realtors
How to Use Median Price Data Responsibly
Median home price data is most useful when treated as one indicator among several, not as a standalone verdict on market conditions. Pair it with these additional data points for a clearer picture:
- Sales volume: How many homes actually sold? Low volume amplifies mix-shift distortions.
- Days on market (DOM): A rising median alongside longer DOM may indicate sellers are holding firm but buyers are pulling back.
- List-to-sale price ratio: Are homes selling above or below asking price? This signals true demand better than headline medians.
- Inventory levels: Months of supply tells you whether sellers or buyers have more leverage right now.
A more complete framework for all of these metrics is outlined in key housing market metrics every homebuyer should know. The core principle: no single number tells the whole story, and the median is no exception.
Common misinterpretations of median data - and the costly decisions they can lead to - are explored further in misreading the housing market. Understanding what this statistic cannot tell you is just as valuable as knowing what it can.
This article is for general informational and educational purposes only and does not constitute financial, legal, or real estate advice. Consult a licensed real estate professional for guidance specific to your situation and local market.
Frequently Asked Questions
No. The median is the midpoint value in a ranked list, while the average (mean) is calculated by dividing total sales value by the number of homes sold. Because a small number of very high-priced sales can inflate the average significantly, the median is generally considered a more reliable measure of a typical transaction.
When housing markets slow, lower-priced homes often sit longer or fall out of the market, leaving proportionally more mid-to-high-priced homes in the sold pool. This mix shift can push the median upward even if individual home values are not actually rising. It's one of the most common misreads in housing coverage.
No - a national or even regional median is far too broad to guide individual offers. Home values are hyper-local, influenced by neighborhood, condition, lot size, school district, and recent comparable sales. Work with a licensed real estate professional and review local comparable sales (comps) for relevant pricing guidance.
Several sources publish median home price data, including the National Association of Realtors (NAR), the U.S. Census Bureau (through new home sales reports), the Federal Housing Finance Agency (FHFA), and various multiple listing service (MLS) providers. Each may use slightly different definitions or geographic scopes, so note the source when comparing figures.
Major sources typically publish monthly reports with a lag of four to six weeks. Because the figures reflect completed transactions rather than current listings, they describe market conditions from the recent past, not the present moment.
The content on this site is provided for informational purposes only and should not be considered a substitute for professional advice. While we strive to provide accurate and up-to-date information, we make no guarantees regarding its completeness or accuracy. Always consult a qualified professional for advice specific to your circumstances before making any decisions