

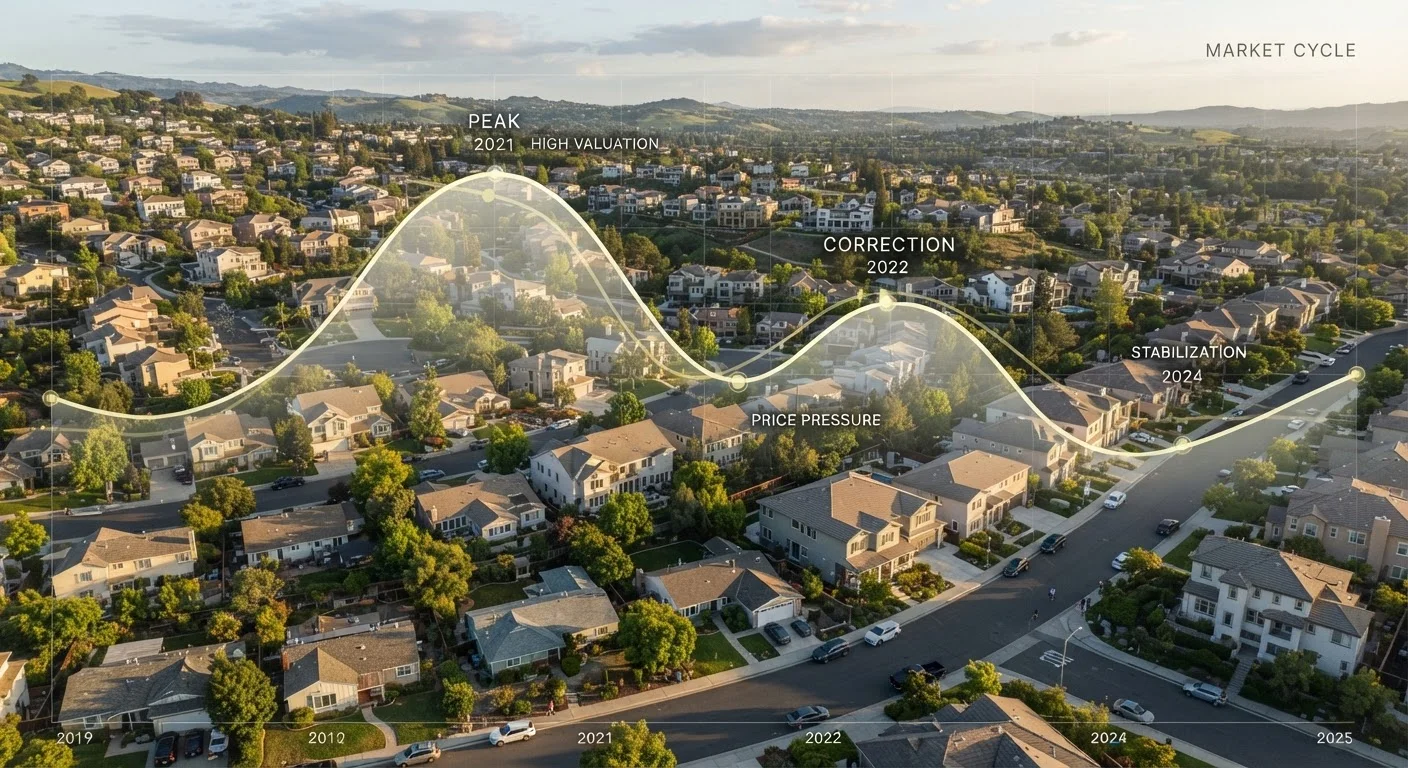
The Four Phases Every Housing Market Moves Through
Understanding a housing market cycle starts with recognizing its four core phases. Each phase has distinct characteristics visible in the data - if you know what to look for.
- Expansion: Demand rises, inventory tightens, and prices climb. Job growth, low mortgage rates, and population movement into an area typically fuel this phase. Homes sell quickly, sometimes above asking price.
- Peak: Price appreciation reaches its maximum rate. Affordability begins to strain, sales volume may plateau, and the first cracks in demand start to appear - even if headlines still sound bullish.
- Contraction: Inventory builds as demand cools. Prices may flatten or decline, days on market lengthen, and sellers begin offering concessions. This phase can be mild or severe depending on the underlying causes.
- Recovery: Demand stabilizes and gradually rebuilds. Prices stop falling and begin a slow ascent, setting the stage for the next expansion.
These phases rarely have clean start and end dates. Markets transition gradually, and different price tiers or neighborhoods within the same city can be in different phases simultaneously. For a deeper look at the supply-and-demand mechanics underneath each phase, see our guide on how supply and demand shape market shifts.
18 months
Typical lag between economic recession and housing price correction
Research from the National Bureau of Economic Research and housing economists broadly supports that residential real estate tends to lag the broader business cycle by six to eighteen months.
4-6 months
Inventory supply threshold separating buyer and seller markets
This benchmark is widely cited by real estate economists and the National Association of Realtors as a general dividing line between market conditions that favor buyers versus sellers.
7-18 years
Estimated range of full US housing cycle length (trough to trough)
Academic and industry analyses of post-WWII US housing data suggest cycle lengths vary considerably, with no single fixed duration.
What Actually Moves Prices Up and Down
Several forces interact to push housing prices through each phase. None operates in isolation.
Employment and Income Growth
When more people are employed and wages are rising, more households can qualify for mortgages and afford higher prices. Employment is one of the most reliable leading indicators of housing demand.
Mortgage Interest Rates
A one-percentage-point rise in mortgage rates can meaningfully reduce the amount a buyer can borrow at the same monthly payment. When rates climb sharply, buyer pools shrink and price growth slows - sometimes reverses. Interest rates touch nearly every corner of real estate, from listing prices to days on market.
Housing Inventory
The number of homes available for sale relative to buyer demand is arguably the most direct price driver. When inventory sits below roughly four to six months of supply - a common benchmark used by real estate economists - conditions typically favor sellers and sustain price growth. Above that threshold, buyer leverage increases.
Demographics and Migration
Long-term population trends, household formation rates, and migration patterns shape the demand side of the equation over years and decades. A metro gaining working-age residents consistently will face different pressures than one with a shrinking or aging population.
“Housing markets are local, cyclical, and driven by fundamentals - income growth, employment, and the supply of homes. When those fundamentals diverge from prices, a correction tends to follow.”
— Mark Zandi, Chief Economist, Moody's Analytics
Why National Data Can Mislead Local Decisions
One of the most common mistakes consumers make is treating national housing headlines as a direct description of their local market. A national average masks enormous variation. During the same quarter, some metros can be experiencing double-digit price growth while others see prices decline.
Local factors - zoning restrictions, employer relocations, infrastructure investment, or even natural disaster risk - can accelerate or dampen whatever the national cycle is doing. Understanding which data points actually matter is an essential skill for any buyer or seller trying to make sense of conflicting signals.
Key local indicators worth tracking include:
- Months of housing supply (active listings divided by monthly sales rate)
- Median days on market
- Sale-to-list price ratio
- Year-over-year price change by neighborhood or zip code
For a practical breakdown of these metrics, our article on key housing market metrics explains what each one reveals and how to interpret it in context. Whether you are navigating a home purchase or evaluating your options as a renter through our renting guide, local data will always be more actionable than national averages.
It is also worth remembering that market cycles are not perfectly predictable. Commentators who claim to know exactly where prices are headed - up or down - are expressing opinion, not established fact. Several persistent myths about real estate - including the idea that prices only ever go up - deserve scrutiny before shaping major financial decisions.
This article is for general educational purposes only and does not constitute financial, investment, or real estate advice. Consult a qualified professional before making housing decisions based on your individual circumstances.
Frequently Asked Questions
There is no fixed length. Historical US cycles have ranged from roughly 7 to 18 years from trough to trough, depending on economic conditions, policy responses, and regional factors. Local markets can move through shorter or longer cycles than the national average.
Broadly speaking, US home prices have recovered from every major downturn on record, though recovery timelines vary widely. Some markets rebounded within a few years after the 2008 crash; others took a decade or more. Recovery is not guaranteed in any specific timeframe or geography.
Higher mortgage rates increase borrowing costs, which reduces buyer purchasing power and typically cools demand. Lower rates do the opposite. Because rates influence affordability so directly, Federal Reserve policy is one of the most watched indicators for predicting cycle direction. See our <a href="/real-estate/housing-market/how-interest-rates-shape-the-housing-market-from-the-ground-up">full explainer on interest rates and housing</a> for more detail.
No. National data reflects an average of hundreds of distinct local markets. A city with job growth and limited land can experience a seller's market even while a slower metro enters a buyer's market. Always look at local inventory and sales data alongside national headlines.
A buyer's market occurs when housing supply exceeds demand, giving purchasers more negotiating leverage and choice. A seller's market is the reverse - strong demand and limited inventory push prices up and reduce time on market. Most markets cycle between these two states over time.
Consistently timing any asset market - including real estate - is extremely difficult, even for professionals. Most housing experts suggest that personal financial readiness, long-term plans, and local market conditions matter more than trying to predict the exact bottom or top of a cycle.
The content on this site is provided for informational purposes only and should not be considered a substitute for professional advice. While we strive to provide accurate and up-to-date information, we make no guarantees regarding its completeness or accuracy. Always consult a qualified professional for advice specific to your circumstances before making any decisions